
Economic Overview
The major theme from Q3 was the Central Bank resolve to dampen inflation. Unfortunately, the only tool in Central Bank arsenals are interest rate increases, something that continues to offend financial markets. There were large rate increases by the US Federal Reserve and Australia’s Reserve Bank in Q3, with the European Central Bank also joining the party with two large increases. Energy remained an issue, with the prospect of the war in Ukraine now becoming a longer-term battle, as Ukraine’s resistance and Russia’s inability to hold territory was in contrast to early expectations. Financial markets were slightly improved in Q3 compared to Q2, with high volatility. The ASX All Ords notched a gain and global sharemarkets managed a slightly positive return in Australian dollar terms, albeit bond markets again slipped.
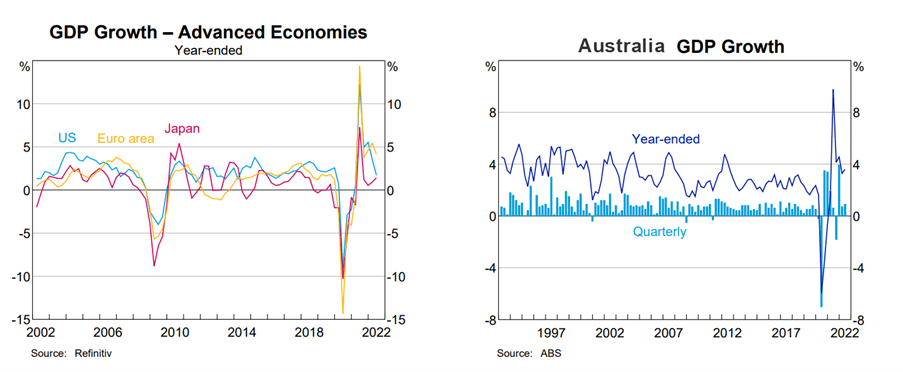
In the US, annual inflation came in at 8.3% in August, slightly down on the 8.5% of July, however the Federal Reserve’s preferred inflation measure (personal consumption expenditures index) increased in August year on year from 4.7% to 4.9%. GDP data fell by -0.6% year on year in Q2 after a -1.6% decline in Q1 confirming the US economy went into a technical recession, with increasing inventories and lower business investment the main detractors from growth. This was in contrast to other more resilient data points. August non-farm payrolls showed 315,000 new jobs added for the month, with 3.5 million new jobs created in 2022. The Flash U.S. Purchasing Managers’ Index inched higher to 51.8 in September from 51.5 in August, slightly ahead of market forecasts.
With some mixed data on growth, there were hopes rate cuts may appear in 2023. This was scuttled at the Jackson Hole summit of central bankers in August, as the Federal Reserve highlighted it was committed to fighting inflation. The Fed raised the federal funds rate by 0.75% to 3.25% in September, the third consecutive increase.
Household debt is the other question with rising rates. Data from Q2 showed debt repayments as a percent of disposable personal income, increased to 9.5%. Still well below the high point of 13.2% in late 2007. Excess savings accumulated during the pandemic were estimated at $2.26 trillion dollars, with higher prices in the consumer space this has seen a drop in excess savings of around $.40 trillion.
Source: RBA 2022
In the Eurozone, the Central Bank increased rates in July and September, shifting the deposit rate to 0.75% and refinancing rate to 1.25%. Annual inflation was estimated at 10% in September, up from 9.1% in August with energy costs the largest contributor, this is in contrast to the US, where inflation is more evenly spread between energy, services and goods. Nord Stream 1, the main gas pipeline from Russia was closed for maintenance in July, Russia then shut it down again in early September. This put pressure on power generators, forcing them to buy natural gas from higher cost sources. It also increased worries over energy shortages this winter, while helping send the euro to a 20-year low against the US dollar.
Eurozone GDP grew by 0.7% quarter-on-quarter in Q2, but there were sign of a weakening economy. The flash composite purchasing managers’ index (PMI) for September came in at 48.2, a third consecutive month below 50. Below 50 indicates contraction, above 50 signals expansion
In the UK, the key event for the quarter was the election of Liz Truss as new Conservative Party leader and UK Prime Minister. The new government immediately unveiled a fiscal package in September, this was poorly received by markets and sent the pound to an all-time low against the US dollar. Pound weakness had already been a factor during the quarter, especially as the US Fed warned it would keep raising interest rates. On the matter of rate rises, the Bank of England raised its key interest rate for the seventh consecutive time in September, taking it 2.25%, the highest level since 2008. In sobering news, Goldman Sachs forecast UK inflation could hit 22% in 2023 if wholesale gas and electricity prices continue to spike over winter.
In Japan, the Bank of Japan held rates, widening the interest rate gap between Japan the US. The gap has been a major factor in the weakening of the yen in 2022. In late September this prompted an intervention by the Ministry of Finance in the currency market when the yen was rapidly depreciating towards 146 against the US dollar. This was the first intervention in support of the yen since 1998, but by the end of September, the yen had already weakened again sitting at 144.6 to the US dollar. GDP estimates showed a quarter-on-quarter annualised growth rate of 2.2%. This was slightly below expectations, but it was seen as a positive with some resilience in consumption and capital expenditure. Finally, inflation continued to edge up with the headline rate reaching 3.0%, and the core rate, excluding fresh food and energy, at 1.6%.
In China, growth continued to slow with Q2 data showing a 2.6% fall in GDP quarter on quarter, reflecting the ongoing impact of strict covid lockdowns. The Caixin China General Services PMI fell to a three-month low of 53.0 in August 2022, due to another wave of covid infections and energy shortages from the drought. The heatwave hit supply chains across the industrial heartlands. In provinces that rely heavily on hydropower, low river flows resulted in the government instructing factories to shut in an attempt to conserve energy. There was growth in the private sector, with services continuing to outperform manufacturing. Expectations for 2022 GDP growth are sharply down at 2.8%, a significant drop from 8.1% growth in 2021. The People’s Bank of China eased rates by 0.15% in August but held in September.
In Emerging Markets, the continuing strength of the US dollar was a worry and there were concerns over the growth-sensitive north Asian markets, such as South Korea and Taiwan, as the outlook for global trade deteriorated. Falling commodity prices weighed in some countries, while concerns about reliable power supplies were an issue from the Philippines to South Africa, with South Africa dealing with rolling blackouts killing business confidence. Finally, if you’re having some concerns about inflation, spare a thought for the Turks. Turkey’s inflation is running above 80%, but the central bank still cut interest rates twice during the quarter, with the economy growing strongly.
Back in Australia, data released in September showed GDP increasing by 0.9% for Q2 2022, with the economy growing by 3.9% year on year, the strongest year on year figure for a decade. The savings rate fell to 8.7%, as spending outpaced growth in income, but the savings rate is still slightly above pre-covid levels. As with many other countries, increasing energy prices continued to be a concern as the Australian Competition and Consumer Commission suggested eastern Australia faces a gas shortfall in 2023.
Interest rates were again a focus in Q3. Annual inflation for Q2 came in at 6.1%, the highest inflation reading since 2001. In response, the RBA increased rates by 0.5% in each month during the quarter, making it five consecutive interest rate increases, and bringing the cash rate to 2.35%. The quick upward move from 0.1% was again felt in the property market. According to CoreLogic, the combined capital index was down -4.3% for the quarter, Sydney at -6.1%, and Hobart at -4.5% suffering the largest falls. While the combined regional index was down -3.6% for the quarter.
Market Overview
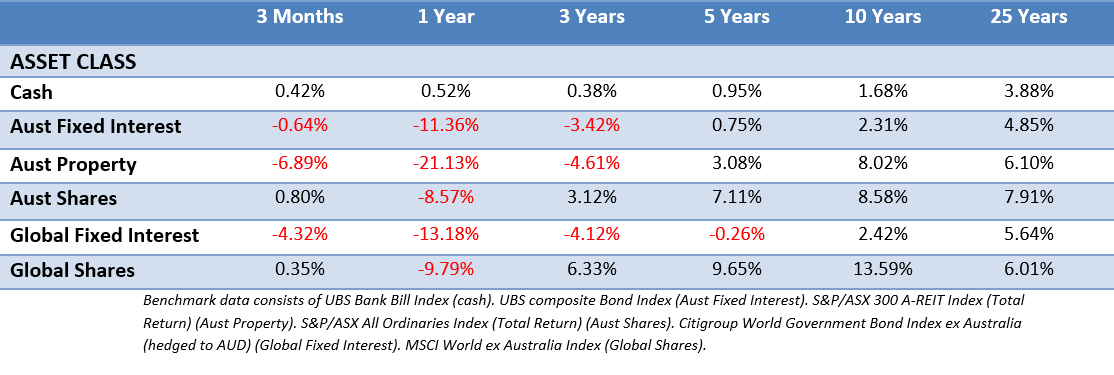
Asset Class Returns
The following outlines the returns across the various asset classes to 30 September 2022.
Global sharemarkets were a mixed bag in Q3, but the falling Australian dollar offered some protection against global falls. Markets started quite positively and rallied until mid-August on the belief inflation data and the US Federal Reserve might be more accommodating on interest rates. As noted earlier, it was the Jackson Hole summit where markets reacted poorly to blunt comments from Fed Chair Jerome Powell and spent the rest of Q3 heading back to where they began the quarter. Bond prices also continued to weaken as rates increased. The 10-Year US Treasury yield moved from 2.98%, finishing Q3 at 3.83%, with 2-year yields rising from 2.92% to 4.22%. In the UK, the 10-year yield moved from 2.23% to 4.09%, while the Australian 10-year yield moved from 3.66% to 3.91%. Many 10-year yields were falling throughout July before setting off higher again across August and September, reaching yields not seen for over a decade. Something for new bond investors to look forward to.
US shares fell in Q3, with the communication services sector, being telecoms and media, among the weakest sectors, along with real estate and materials. The consumer discretionary and energy sectors proved the most resilient. The S&P 500 large-cap index dipped into bear market territory again in the quarter, relinquishing the strong bounce off the June lows finishing down -4.9%. The small-cap Russell 2000 index lost -2.2% for the third quarter. Returns in the US have, like in many other countries, favoured value companies throughout 2022.
Eurozone shares saw further sharp falls in Q3 amid the ongoing energy crisis, rising inflation, and ultimately fears about economic growth. Every sector saw negative returns, with the steepest falls for communication services, healthcare and real estate which has been pressured by rising bond yields. The German DAX was off -5.2% and the French CAC 40 down -2.7% with the majority of the falls in the final weeks of the quarter. Meanwhile, pharmaceutical companies were hit over potential liabilities related to US litigation around the heartburn drug Zantac.
UK shares fell in Q3 with the wider market down -4.5% and the FTSE 100 down -3.85%. Large multi-national consumer staples and energy companies were the outperformers. These areas are seen as better placed to cope with a potentially stagflationary environment, where growth is low, and inflation is increasing. The strong US dollar was a positive in these areas of the market, given these companies see a large part of their revenues from overseas. In contrast, the potential impact of rising energy bills on consumer discretionary spending weighed heavily on retailers, travel and leisure, home construction and anything with a domestic focus.
In Japan, after rising through July and August, the Japanese share market followed global equity markets lower in September, with the Nikkei down 1.72% for the quarter. Ignoring economic data, the main influence on Japanese shares came from the results announcements for Q2, which finished in August. Although profit eased from Q1, overall results were ahead of expectations and despite increasing costs, profit margins appear to have remained resilient.
Asia (ex-Japan) and Emerging markets shares were a mixed bag depending on the influence. Most Asian sharemarkets were weaker, with China the weakest Asian index due to more global concerns over rates and inflation, tensions with Taiwan, and the increasing spread of covid and the potential for further harsh lockdowns. In Hong Kong, share prices were sharply down as investors continued to sell riskier assets, heading to the perceived safety of government bonds given the threat of interest rate hikes and recession. India and Indonesia saw gains, but they were tempered by rate concerns toward the end of the quarter. Poland, Hungary, and the Czech Republic all struggled due to the war and energy crisis. Brazil was one of the stronger performers as data showed the economy growing strongly and CPI inflation cooling.
The Australian market (All Ords Accumulation) was up for the quarter, though gave up most of its early gains in the final weeks as US interest rate concerns flared again. Consumer discretionary, consumer staples and industrials saw mild falls, but the major underperformer was utilities, off -13%. Financials finished flat, with their weighting probably keeping the market steady, while energy notched a small gain.
The Value of Value
Generally, when we’re discussing investment returns or how portfolios perform, we stick to using various market indices as the basis of what we’re discussing. It’s often easier to get a grasp on because it’s standard and it aligns with what is quoted in the media. The other reason is, if an investor can just sit and get the market return from these various indices, such as the ASX All Ords S&P 500 or MSCI World, it’s a win. They’ll likely do better than investors who spend their time chasing hot funds year to year or trying to time their entry and exit every time there’s a scare.
We also allocate portfolios beyond just the market, to specifically account for value shares. It’s only a small consolation, but over the last year, one of the least punished areas of the market have been value shares. The following table shows the local and global markets against respective value funds and respective funds with a 30% allocation to value.
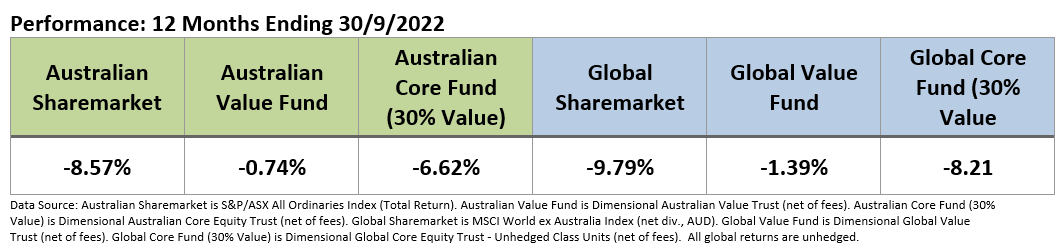
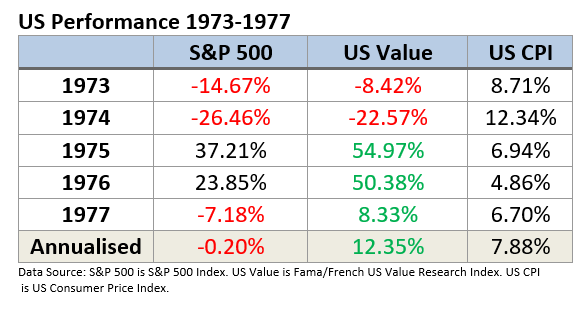
As noted, it’s only a small consolation in a rough year, however the interesting thing about value shares is they’ve shown strong performance characteristics going through periods of high inflation. The mid 1970’s was one such period. Investors certainly still had to tolerate some wild falls as inflation spiked, but an allocation to value proved rewarding to those that held on. It outperformed the major index, being the S&P 500, while also outpacing inflation.
The early 1980’s in Australia is another example (the whole 1980’s could be used) where value performed better than the wider market during a rough period where inflation spiked.
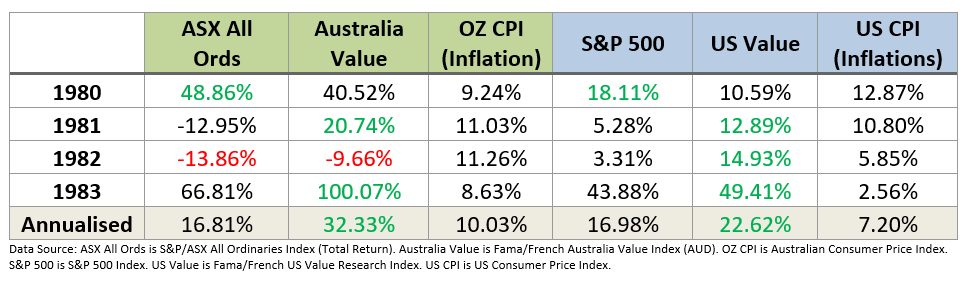
There are a few eye-catching numbers there. We’re certainly not suggesting if inflation moderates that investors will be looking at 100% returns in value shares, but it’s important to keep in mind market recoveries can be swift and certain market factors, like value, can potentially see even stronger moves. This is compensation for the extra risk of holding them. The market index is always a great start for investors, but allocations to other areas can prove rewarding. While it’s not a guarantee, having allocation to value has helped offset some rough inflationary periods. The idea being that having earnings now in a value company is more valuable than future earnings in a growth company.
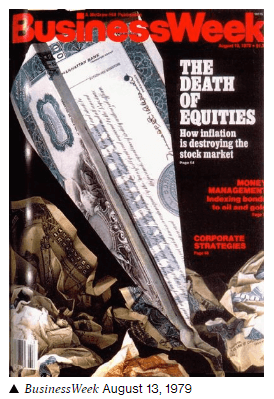
The final thing to remember is while there are always a lot of scares around what inflation will do to the sharemarket, everything gets priced in, and the market moves on. This famous magazine cover was published in the US five months before the period above began in 1980. Despite the scare, there was certainly no death of equities and inflation didn’t destroy the sharemarket!
This material is provided for information only. No account has been taken of the objectives, financial situation or needs of any particular person or entity. Accordingly, to the extent that this material may constitute general financial product advice, investors should, before acting on the advice, consider the appropriateness of the advice, having regard to the investor’s objectives, financial situation and needs. Looking for a comparison of the vas/vgs portfolio split? This is not an offer or recommendation to buy or sell securities or other financial products, nor a solicitation for deposits or other business, whether directly or indirectly.