
Economic Overview
The major theme from Q2 was the swift upward movement of interest rates to combat inflation, along with the implications for economies, sharemarkets and bond markets. Two of the three Central Banks that may have been considered laggards up to this point, the US Federal Reserve and Australia’s Reserve Bank, appeared to be making up for lost time in Q2. Both moved aggressively, with sharp increases in rates during the quarter. Energy also came into focus, as the war in Ukraine continued and the thinking turned to potential gas shortages in Europe. Any remaining euphoria from 2021 left financial markets in Q2, with the quarter being poor for both sharemarkets and bond markets. The cost of living was noted to be a major issue across most economies.
In the US, the focus narrowed in on inflation and the likely response from the Federal Reserve after a 0.25% increase in March. Annual US inflation, as measured by the consumer price index (CPI), came in at 8.6% in May, the largest increase since the period ending December 1981. The food index increased 10.1% annually, which was the first double digit increase since March 1981. Expectations were for 0.5% rate increases in May and June, but with inflation becoming a bigger issue, the Federal Reserve increased rates by 0.5% in May and 0.75% in June, bringing the federal funds rate to 1.58%.
The Federal Reserve signalled more rate rises were to come, but also admitted it has a challenge to bring inflation down and not cause a recession. The US economy still appears robust, with the job market continuing to be tight. Unemployment is at 3.6% with an estimated 1.9 job vacancies for every person looking for work, but there are signs of a slowdown. Flash US Manufacturing Purchasing Managers Index (PMI) fell from 57 in May to 52.4 in June, indicating the slowest growth in factory activity in two years.
Source: RBA 2022
In the Eurozone, ongoing disruption to German gas supplies due to the war in Ukraine saw Germany move to phase two of its energy emergency plan. Phase three would involve rationing gas to industrial users, and possibly households. The war has seen the largest displacement of European citizens since World War 2. Prior to the war, the EU faced headwinds due to supply-chain disruptions, and goods inflation. The war triggered sharp increases in energy and commodity prices, especially those heavily linked to Russian trade. Positively, job growth continued on its post-pandemic stable trajectory.
A Eurostat inflation estimate for June stood at 8.6% in Europe, up from 8.1% in May, with energy being the largest factor in the rise. In its June policy decision release, the ECB noted it would increase rates 0.25% in July, with another move expected in September. Concerns over the cost of living and possibility of recession saw the European consumer confidence reading fall to -23.6 in June, the lowest level since the early stages of the pandemic. Given the ongoing war and the fact its key rate was already negative, the ECB has a big challenge ahead with potential stagflation, where economic growth stalls as inflation increases.
In the UK, The Bank of England made two consecutive 0.25% hikes to take the Bank Rate to 1.25%, as it continued to warn of higher inflation. April’s CPI came in at 9% with May’s at 9.1%, driven by a significant increase in energy prices. This was the highest annual figure since the current set of UK National stats began in January 1997, with modelling suggesting it was likely the highest figure since 1982. The Bank of England forecasts peak inflation to be 10%, before falling back to 6% by the end of 2022. UK GDP is estimated to have grown by 0.8% in Q1. UK chancellor Rishi Sunak unveiled further measures to help households offset higher energy bills.
In Japan, the yen weakened significantly against the US dollar, breaching the 130 level for the first time in two decades. Comments from the US Federal Reserve pointed to a widening interest rate differential with Japan materialising earlier than expected. Despite some pressure to address interest rates, the Bank of Japan didn’t move, and policy remained unchanged. With the rising cost of living a global issue, in Japan the public have thus far remained relatively unscathed. Inflation numbers released in May, showed core CPI (excluding fresh food) jumped to 2.1%. Data released toward the end of Q2 showed worldwide production at Japanese automakers declined for a third consecutive month, with poor supply of parts from China an issue.
In China, there were signs of improvement during Q2 after a tough Q1. Strict Covid-19 protocols enacted by the government resulted in lockdowns in several major cities, leading to the closure of multiple manufacturing factories. Shanghai, China’s largest city by gross production, was locked down tightly while Beijing and other parts of the country also imposed varying levels of quarantine to contain the worst outbreak since the pandemic began. Manufacturing PMI for China rose to 49.6 in May from April’s 26-month low of 47.4, amid an easing of COVID-19 restrictions. The government have taken further steps to encourage growth, lowering a key interest rate for long–term loans as well as issuing a statement of intent to provide clarity on regulation in the technology sector.
In Emerging Markets, it was a mixed bag, often depending on commodities produced. Net industrial metal exporters, such as South Africa, Brazil and Peru, struggled due to fears of a lack of demand for materials from Chinese factories, and the copper price spending the majority of the quarter in a downtrend. Net energy exporters, such as Kuwait, Qatar and Saudi Arabia, fared much better. Hungary and Poland struggled due to proximity to Ukraine, with Poland hit hard following Russia’s decision to restrict energy supply. Central banks in both countries increased policy tightening, while the Hungarian government announced windfall taxes on banks and other large private companies.
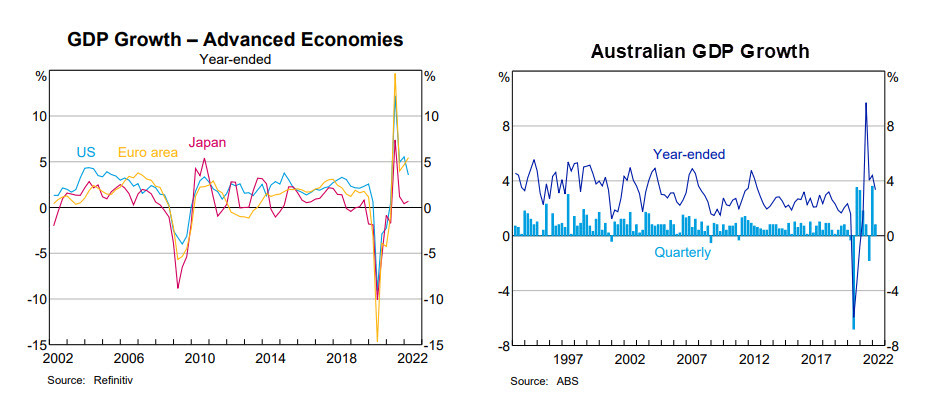
Back in Australia, data released in June showed GDP increasing by 0.8% for Q1 2022, with year-on-year growth at 3.3%. The savings rate was at 11.4%, still well above pre-covid levels. The biggest event for the quarter was the election, with the Labor party forming a majority government. However, there was little time for a honeymoon as soaring east coast energy prices posed an immediate issue for households and businesses.
The other big news in Q2 was interest rates. After reaffirming in March that “the Board will not increase the cash rate until actual inflation is sustainably within the 2 to 3 per cent target range”, inflation for Q1 came in at 5.1% in data released in late April. A few days later at their May meeting, the RBA increased the cash rate by 0.35%. The board noted “resilience of the Australian economy is particularly evident in the labour market”. The RBA board followed with another 0.5% increase in June. As expected, the property market quickly felt the rate increases. CoreLogic’s 5 Capital City Index saw a -0.9% fall for Q2, with the most expensive markets, Sydney down -2.8%, and Melbourne down -1.8%, the big drags.
Market Overview
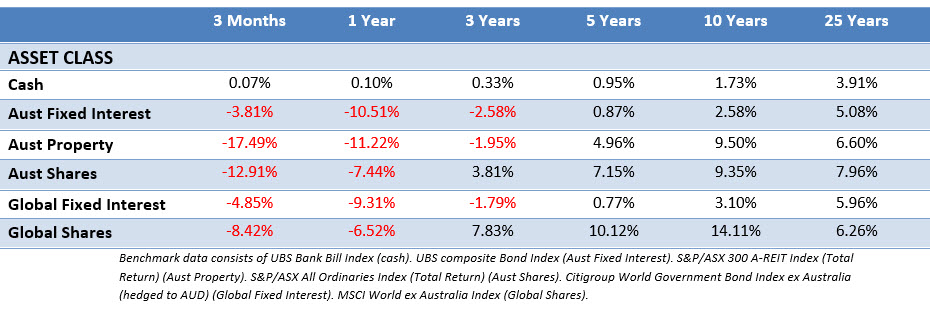
Asset Class Returns
The following outlines the returns across the various asset classes to 30 June 2022.
Global sharemarkets continued their poor performance in Q2 as they priced in the reality of rising interest rates. This also saw bond prices continue to face headwinds as rates moved upward (when rates increase bond prices fall, when rates fall bond prices rise). The 10-Year US Treasury yield moved from 2.35%, finishing Q2 at 2.98%, with 2-year yields rising from 2.33% to 2.92%. In the UK, the 10-year yield moved from 1.61% to 2.23%, while the Australian 10-year yield moved from 2.84% to 3.66%. All 10-year yields saw much higher peaks in mid-June, before the market started considering the potential for recessions if Central Banks misstep and the prospect rates may not increase as much as expected. Overall, it was said to be the worst period for bonds since 1842.
US shares were negative in Q2 with investors focused on inflation and the response from the Federal Reserve. Declines hit all sectors, although consumer staples and utilities remained the most resilient. There were dramatic declines for some stocks, most notably in the media & entertainment and auto sectors, Disney was down 31% and General Motors 29%, for the quarter. After 2021 being a stellar year for earnings growth, the estimated earnings growth rate for the S&P 500 in Q2 was 4.1%, that would be the lowest since Q4 2020 at 3.8%.
Eurozone shares struggled as hope for a resolution or ceasefire in Ukraine faded during the quarter, as early talks failed to yield any significant agreement. Top performing sectors included energy and communication services while information technology and real estate experienced sharp falls. Despite a high exposure to financials and energy sectors and a relative lack of technology names, the French and German markets saw losses of -11.32% and -11.29% respectively.
UK shares were again more resilient than most of their global counterparts, although the large cap FTSE 100 saw a 4.5% fall for Q2, but again smaller areas of the market suffered double digit falls. By sector, the positives were healthcare 5.86%, telecommunications 3.08%, energy 1.55% and consumer staples 1.23%. Consumer discretionary sectors, such as retailers and housebuilders, performed particularly poorly. This was in line with many other developed markets seeing high levels of inflation.
Japanese shares were negative over the quarter, with the Nikkei 225 down 5%, with the bulk of companies reporting results in May. With the current macro environment, there were few positive surprises, and some companies kept their forecasts for the coming year quite conservative. However, the tone of results and guidance was still better than expected. Chipmakers Tokyo Electron and Advantest were punished in June, while Kansai Electric was up 16% for the quarter as the mood toward nuclear energy softened due to the ongoing energy crisis.
Asia (ex-Japan) and Emerging markets shares were also sold off in Q2, albeit with emerging markets being one of the better performers in Australian dollar terms, down -3.3%. South Korea struggled, with financials, technology and energy companies badly hit amid fears of a recession. Shares in Taiwan were also significantly lower on fears rising inflation and supply chain problems would weaken demand for technology products. Indian shares also declined over the quarter as global volatility, rising inflation and soaring energy prices weakened investor sentiment. China was the only emerging market to generate a positive return over the quarter.
The Australian market (All Ords Accumulation) was up for April, but sold off heavily in May and June with the RBA’s interest rate announcements, along with global factors weighing. All Ords falls almost mimicked those of the Financials market sector as there were fears a housing slowdown would put pressure on earnings for Australia’s big four banks, though banking figures dismissed this toward the end of the quarter, suggesting they were well provisioned to deal with any issues and Australians were still sitting on significant levels of cash. Other sector weakness was seen in Consumer Discretionary and Information Technology, Materials and Real Estate. Utilities and Energy managed small gains.
Finally, there were eyebrows raised about some of the newer inclusions to the ASX 200. The lithium explorers who’d previously been flying, such as Core Lithium and Lake Resources, found themselves with a market capitalisation large enough to be included in the major benchmark and were promptly sold off heavily on inclusion. Lake fell 55% in the week after inclusion and Core fell 30%. Battery metal companies have been booming and busting for several years now, showing as volatile as markets can be, hot sectors can do a 180 flip at a much faster pace.
Where to From Here?
Whether you want to call the last quarter “repricing”, “selling off” or “losing”, the result is still the same: it’s not nice, but it’s nothing new. Markets have a habit of panicking first and asking questions later. That means returns never come in a straight line and at various points in time we’ll see losses in our portfolio. If you’re measuring by the end of June 2022, you will see losses, the reality is the market has already moved on. In the subsequent days, the ASX is up over 2% and the US markets are up over 3%. Will that last, continue or go into reverse?
We don’t know, but we’ve taken a look back in time to see what bad starts to the year since 1980 look like and what followed. We’ve looked at both Australian and Global shares. In some instances, while one market fell in the first half of the year (H1), the other didn’t, so it’s greyed out, and we had no need to look at the second half (H2).
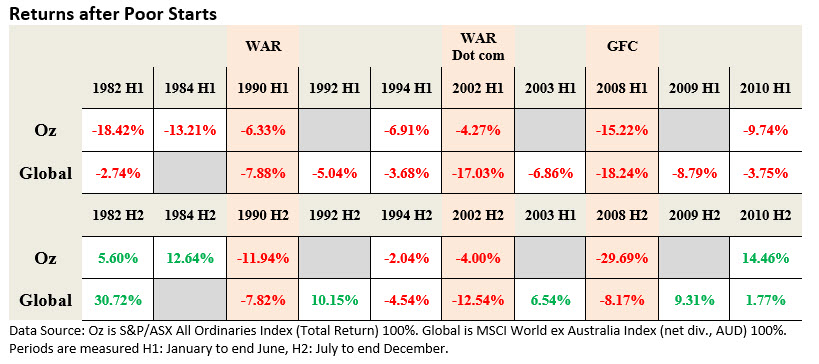
It’s not particularly conclusive because it also includes three anomalies where the years where quite torrid for notable reasons. One, being a gulf war. Two, being the aftermath of a terrorist attack, the leadup to another gulf war and the end of the dotcom bubble. And three, a major global financial crisis in 2008. Are we currently in such torrid times? That depends on who you ask, but excluding those markets, there have tended to be bounce backs in the second half of the year after a poor start, 1994 being the outlier.
For US shares (using the S&P 500) we have seen one of the poorest starts to the year since the 1960’s. Since 1960 there have only been two first half losses in the magnitude of 2022’s, those were in 1962 which saw a -22.28% fall and 1970 which saw a 19.43% fall. What followed? In 1962 it was a 17.44% recovery and in 1970 it was a 29.11% recovery.
We don’t know what happens next, but we do know as shares sell off, historically, expected returns are higher. What we do know is shares and bonds are either cheaper than they were or now present an increased opportunity for yield. For long-term investors, there are mixed signals. There is still pent up demand, and a huge demand for labour, but weakening consumer confidence. There is talk of recession, but the economy spends most of the time in expansion, so it’s ultimately better to invest for growth.
Returns never present themselves in a neatly wrapped box. The risk, or price we pay, is the volatility we need to endure to get the return. If we’ve stayed for the risk, we may as well stay for the reward.
This material is provided for information only. No account has been taken of the objectives, financial situation or needs of any particular person or entity. Accordingly, to the extent that this material may constitute general financial product advice, investors should, before acting on the advice, consider the appropriateness of the advice, having regard to the investor’s objectives, financial situation and needs. This is not an offer or recommendation to buy or sell securities or other financial products, nor a solicitation for deposits or other business, whether directly or indirectly.