
Economic Overview
The second quarter continued to be shaped by the ongoing conflict in the Middle East, but as tensions eased, global equity markets saw a strong recovery in Q2, with optimism a deal could be reached to end the Iran war and open up the Strait of Hormuz. All things AI returned as a driver of returns, which boosted tech heavy markets and economies that have significant semiconductor listings and deep electronic supply chains. Emerging markets, and North Asia in particular, continued to dominate, due to heavy exposure to AI and semiconductor related companies, while it was the commodity and more domestic focused markets that saw more modest returns. Energy declined sharply, while gold and other precious metals came under pressure due to rising inflation expectations. Some government bond yields saw multi-year highs mid quarter, before easing as the likelihood of a deal between the US and Iran increased.
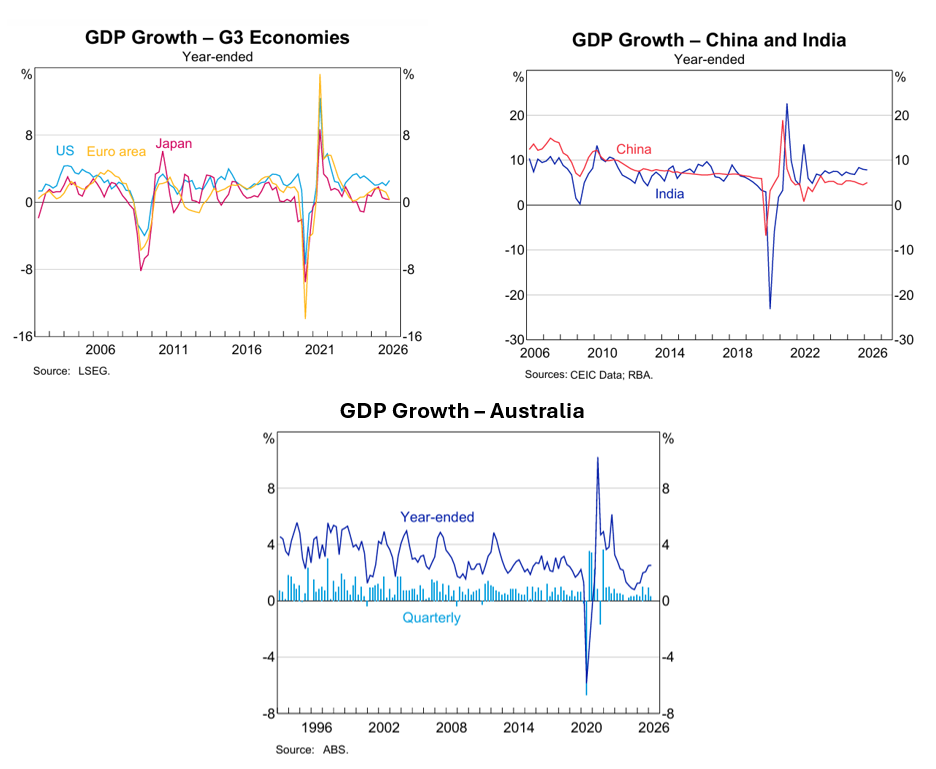
In the US, GDP came in at an annualised rate of 2.1% for Q1 2026, which was much better than feared, and significantly better than the prior quarter’s 0.5% figure. Underneath the headline, consumer spending was down sharply to 0.5%, the weakest number in several years, this was due to a significant slowdown in services demand from 1.8% to 0.5%. Gross private domestic investment increased 7.9%, with business investment in equipment up 15.8% and intellectual property products up 13.8%, both were majorly influenced by capital deployment into AI infrastructure. Residential investment fell -7.8%, with non-residential structure investment down -4.7%. Government spending increased 4.4%, as activity got back to normal after the federal shutdown at the end of 2025.
May’s employment report came with a surprise to the upside. Nonfarm payrolls were up 172k, more than double the 80k consensus, with the unemployment rate holding at 4.3%. The unemployment rate has remained in the 4.3% to 4.5% range since July 2025. Job gains also broadened, leisure and hospitality added 70k jobs, which was well above its 14k monthly average, which was likely related to the World Cup. Local government added 55k, health care added 35k, while financial activities lost 22k.
The May CPI number was 4.2% year on year, and the highest since April 2023, up from 3.8% in April. On a monthly basis, headline CPI increased 0.5%, with the energy index accounting for over 60%. This highlights the inflation pressure in energy, with gas (petrol) prices up 7% in May and up 40% from a year ago, with fuel oil is up 58% over the year. In contrast, core CPI, which excludes food and energy, was up 0.2% in May and 2.9% year on year, only slightly above the prior month’s 2.8% figure.
In other US news, the Federal Open Market Committee (FOMC) held its first meeting under new Chair Kevin Warsh in June. Warsh succeeded prior Chair Jerome Powell. The Committee voted 12–0 to maintain the target range for the federal funds rate at 3.50% to 3.75%, where it has stood since December 2025. Pentagon briefings indicated the operations in the Middle East cost more than $10 billion in the first week of the war, while the Department of Defense’s expected supplemental funding request, will be in the range of $100–$200 billion. Finally, the median age of a first-time homebuyer hit a record 40 years old.
RBA 2026
In the Eurozone, the annual inflation rate was 3.2% in May, up from 3.0% in April. The European Central Bank increased interest rates by 0.25% in June with the above-target inflation as a result of the energy shock caused by the conflict in the Middle East. The Eurozone remains the most exposed major economy to the Middle East oil shock. The ECB has flagged higher energy prices as a source of elevated inflation and weaker growth, subsequently raising its outlook for inflation this year and next, along with cutting growth projections. Eurozone Q1 GDP fell by -0.2% quarter on quarter, with the year-on-year figure sitting at 0.3%, down significantly on the Q4 2025 number of 1.2%. The flash purchasing managers’ index for the eurozone indicated that the downturn in activity in May eased slightly in June. The reading for June was 49.5, up from 48.5 in May, but readings below 50 indicate a contraction in economic activity.
In the UK, GDP came in at 1.2% for the year ending April, unchanged from March, and the most consistently strong growth figures since July last year. Annual inflation was 2.8% for the 12 months ending May. This remained unchanged from April’s level, and still above the inflation target. The Bank of England kept interest rates on hold at 3.75% throughout the quarter, however two policymakers voted to increase rates at its June meeting. The ongoing unpopularity of Prime Minister Keir Starmer came to a head during the quarter, first with poor local election results in May. Then Greater Manchester Mayor Andy Burnham sealed Starmer’s fate in June. Burnham, a popular figure, but without a seat in the UK parliament, was seen as the best person to challenge Starmer for the leadership of the Labour Party and become PM. Burnham won a June by-election, and in response, Starmer announced his resignation. As much as it was a large shift, markets reacted little to the news.
In Japan, Q1 2025 GDP came in at 0.6% year on year, and up on the slightly upwardly revised 0.2% Q4 2025 figure, this was the weakest number since Q2 2024. Annual inflation moved higher to 1.5% in May from 1.4% in April, as declines in energy prices moderated with the expiration of government subsidies. Price growth increased in transport, housing, clothing, household goods, recreation, while education prices continued to ease down -6.1%. Food prices rose by 3.5% over the year, in line with April’s number as rice fell for the first time since the end of 2022. Core inflation stood at 1.4%, unchanged from April and in line with market consensus, but remained below the central bank’s 2% target for a fourth successive month. The Bank of Japan increased its policy rate by 0.25% to 1% in its June meeting. It was a 7-1 decision and the highest it’s been since September 1995. While inflation is below target, the move was aimed at preventing and energy shock from the Iran war fueling broader inflation. In its statement, the board said underlying inflation could accelerate above the 2% target due to rising energy costs. The yen also continued to be weak over the period, hitting a near 40-year low versus the dollar.
In China, GDP came in at 5% year on year in Q1, up from 4.5% in Q4 and ahead of forecasts of 4.8%. This was the fastest annual growth in three quarters, and supported by strong export performance, although Beijing is bracing for potential fallout from the Iran conflict. So far, the economy has managed to absorb the shock with limited disruption, despite around 45%–50% of Chinese oil imports coming via the gulf, which is the largest of major economies. However, China has been cushioned by its strategic reserves, being able to diversify toward Russia and Central Asia, and the electrification of its transportation fleet. Since January’s 0.2% reading, annual inflation has remained at 1% or above through June, and while transport related costs have filtered through inflation, food prices have continued to slide. This is due to persistently weak pork prices and continued falls in fresh fruit prices.
In Asia (ex-Japan & China) and Emerging markets, outcomes were dictated by where countries stood on the AI or commodity spectrum. South Korea saw its strongest annual GDP figure since 2024, at 3.8%, as the boom in all things AI and semiconductor has strengthened its economy, despite a heavy reliance on Middle Eastern oil. In Brazil, polls showed President Lula establishing a lead over opposition right-wing senator Flavio Bolsonar in the October presidential election race. While the Brazilian central bank cut rates as expected, the cycle is likely to be shallow in the face of persistent inflation. In Indonesia, the central bank raised rates twice in June to protect the currency amidst balance of payment concerns. The Middle East energy exporters, Saudi Arabia and Qatar saw negative Q1 GDP numbers, and unfortunately both have incurred serious damage to energy facilities.
Back in Australia, data released in June showed GDP increasing by 0.3% for Q1 2026, below the forecast of 0.5% and down on the upwardly revised Q4 25 figure of 0.9%. Year on year GDP growth end of Q1 sat at 2.5%, while GDP per capita, noted as a proxy for living standards, was down -0.1% for Q1, and up 1% for the year ending March. Annual inflation was up 4.2% in April and 4% in May, which makes three consecutive readings at, or above 4%, and still well above the RBA’s 2-3% target. The largest contributors to annual inflation for the period ending May were housing at 6.5%, and clothing and footwear up 5.0%. Education at 4.8% and alcohol and tobacco 4.7% were also elevated.
The ongoing elevated inflation numbers saw the RBA increase rates by 0.25% at its May meeting from 4.1% to 4.35%. This returned interest rates back to their previous peak of the last increase cycle, which held from November 2023 to January 2025.
After the May meeting, the board acknowledged, “Prior to the conflict in the Middle East, inflation in Australia was materially above target, and the economy and labour market were operating with ongoing capacity pressures.” And “The Board assessed that inflation is likely to remain above target for some time and that the risks remain tilted to the upside, including to inflation expectations. Higher fuel prices are adding to inflation and there are indications that this is likely to have second-round effects on prices for goods and services more broadly.”
The other notable occurrence during the quarter were the changes to capital gains tax and negative gearing in the Federal Budget. The Labor government said these were targeted at helping first home buyers get into the housing market. There were questions, if that was their sole intention, why the capital gains tax changes were extended to other asset classes beyond residential housing.
And on residential housing, according to Cotality data, national house prices have gone negative on a monthly, -0.4%, and a quarterly, -0.7% basis. Overall, the combined capitals were down -1.3% while combined regionals were up 1.1% for the quarter. Sydney was down -3.2% for the quarter and up 0.3% annually. Darwin 5%, Perth 2% and Hobart 1.4% were the main upward movers over the quarter. On an annual basis, Perth was up 23.9%, with Darwin and Brisbane up 19.8% and 17.4% respectively. Melbourne was negative for the year, down -0.9%. For rents, the national vacancy rate moved up slightly to 1.6% in June, from 1.5% in May. Again, the long-term average sits at 2.5%. Rental growth was again strong, up 3.5% annually in the capitals and 4.2% in the regions.
Market Overview
Asset Class Returns
The following outlines the returns across the various asset classes to 30 June 2026.
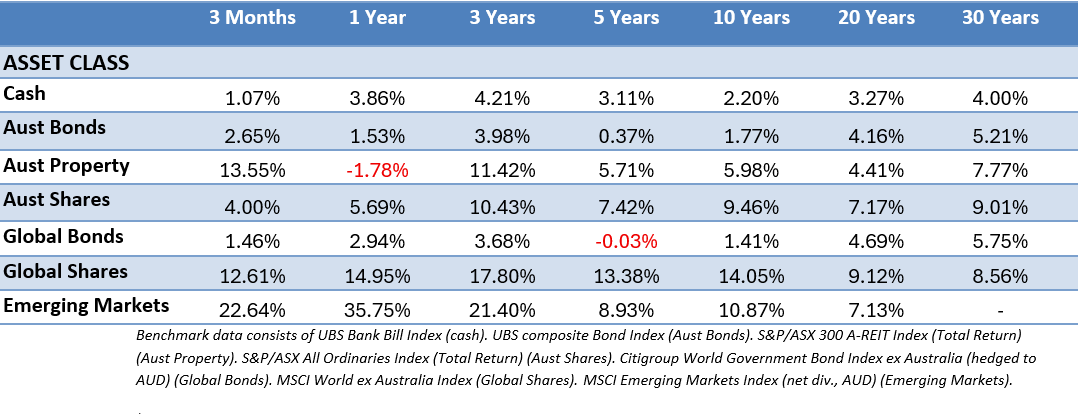
Global stocks saw a strong bounce in Q2 as they recovered from the Iran/energy/inflation related sell off. The Australian dollar moved higher from the start of the quarter, from 69 to 72 cents USD in mid May, before almost returning all the way back to where it started by the end of the quarter. It was a similar story with the AUD against the Euro, appreciating for the first six weeks of the quarter before easing in the back half. MSCI World ex Australia (Hedged) was up 13.96% for Q2, while the unhedged index was up 12.61%, a 50/50 split of the two was up 13.29%. US large caps were up 15.20%, while US small caps shot ahead 21.49%. Global stocks ex US (in USD) were up 10.22% for the quarter. Emerging markets also notched a very strong quarter, to finish up 22.64%, and up 35.75% over the year. The Australian stockmarket was one of the laggards, up a reasonable 4%, but trailing most of the world. Australian listed property saw a strong recovery after its double digit fall in Q1, up 13.55%, but still negative for 12 months.
It was a positive quarter overall for bonds, albeit with some volatility with the Middle East conflict ensuring bond yields tracked energy markets. As tensions escalated mid-quarter, government bond yields hit multi-year highs before retreating with signs of a potential US-Iran agreement. The 10-Year US Treasury yield moved up steadily throughout the quarter, hitting 4.59% in mid May before easing to finish at 4.46%. US 2-year Treasury Note yields moved up strongly throughout the quarter, starting at 3.8% and finishing at 4.19%. In April, the UK 10-year gilt yield reached its highest level since 2008, reflecting the inflationary consequences of higher energy prices as well as concerns over fiscal and political vulnerabilities ahead of local elections, but after starting the quarter at 4.85% they slid back to finish at 4.76%. In Australia, the 10-year government bond yield eased from near 5% to finish at 4.73%. While the 2-Year Australian government bond yield also eased throughout the quarter from 4.66% to close at 4.43%.
In the US, there was a robust market recovery with the S&P 500 reaching an all-time high in early June before a late-quarter pullback. The S&P 500 finished the quarter up 15.2% and 10.2% year-to-date. Large-cap, AI-linked names drove the recovery, as investors looked beyond energy related inflation risks and back toward earnings, productivity, and AI capital expenditure plans. Capital spending tied to AI continues to be a focus, with corporate commitments to AI infrastructure from the big four cloud hyper-scalers, Microsoft, Meta (Facebook), Amazon and Alphabet (Google) on target to hit $725 billion for 2026 alone. This has put a floor under tech earnings even with valuation stress. The tech sector was up by 28% in Q2 and is up 16.8% for the year. Other leading sectors included industrials, up 14.8%, real estate 11.8%, and Health Care 10.2%. Energy struggled this quarter, down -13.4%, but thanks to Q1’s outperformance it’s still up 20% for the year. Market leadership has also broadened beyond mega-cap technology in 2026. Year to date, only Alphabet has outperformed the broader market, while the “Magnificent 7” as a group have declined -3%. Given the ongoing concerns about concentration and these seven companies dominating the market, it’s welcome to see market performance become less concentrated. In small caps, the Russell 2000 rebounded sharply on optimism around domestic growth. It was up 21.6% for the quarter and 22.6% so far in 2026. This return marks its best first-half performance since 1991.
In the Eurozone, stocks also saw double digit gains overall, with the MSCI EMU up 15.31% in EU terms, making it 12.52% year-to-date. In France, the CAC 40 was up 7.51% for the quarter, Italy’s IT40 was up 16.64%, while the German DAX was up 10.21%. The top performing sectors were technology and financials. Tech stocks performed well amid some strong corporate earnings and optimism over the outlook for AI and related technologies. As elsewhere, energy suffered negative returns as oil prices fell back down to levels seen before the outbreak of hostilities, while communication services were also in the red for the quarter.
In the UK, stocks gained during the quarter, but being supported by the energy sector’s gains during Q1, meant Q2 wasn’t going to be as healthy as many other markets. The FTSE All-Share index was up 3.77%, with those declines in the heavyweight energy sector capping the broader index. The top performing sectors were consumer discretionary, real estate and financials. Breaking down by size, the large cap FTSE 100 was up 3.15% for the quarter, while the small and mid-sized companies performed much better. The mid cap FTSE 250 was up 8.53%, and UK small caps were up 9.77%.
In Japan, stocks enjoyed a strong quarter, with the TOPIX Total Return up 14.4% and the tech heavy Nikkei 225 up 37.21% for Q2. Investor sentiment was buoyed by Middle East tensions easing after the US-Iran ceasefire memorandum, which saw oil prices decline. AI and semiconductor related stocks and financials were the strongest performers, though valuation concerns and profit-taking in AI names kicked off a period of volatility in June. Quarterly earnings season saw stocks with strong results and positive guidance performing well, while weaker guidance was punished.
Asia (ex-Japan) and Emerging markets were gangbusters, with the MSCI AC Asia ex Japan Index up 27.27% in Australian dollar terms, while the MSCI Emerging Markets Index was up 22.64%. Performance was dominated by the tech orientated markets of Taiwan and Korea, again driven by strong gains in memory and semiconductor stocks from AI demand, with returns increasingly concentrated in a narrow group of AI beneficiaries. Korea rallied to all-time highs with Korean companies also delivering strong earnings and revisions. It was a similar story in Taiwan, with MSCI Taiwan reaching all-time highs, as relentless US hyper-scaler capex continues to benefit the north Asian hardware supply chain. Hungary and Egypt also outperformed over the quarter, but many other emerging markets lagged the broader index, highlighting gains came from a narrow leadership with performance increasingly driven by AI. While positive, India lagged the broader index as the country’s IT services sector is considered at risk from AI. South Africa struggled, driven by a sharp sell-off in mining stocks due to weakness in commodities and precious metals. Indonesia was the worst performer, firstly due to weaker sentiment around commodities, softer external demand, and the country’s minimal participation in the AI-driven cycle, but it also remains under pressure from a potential MSCI downgrade to frontier status. That decision has been delayed until November. China also underperformed, with caution amid ongoing property sector stress, lumpy domestic demand, policy uncertainty and less exposure to the AI-driven rally across the quarter.
In Australia, the ASX 300 was up 4.14% in Q2 with the majority of sectors in the green, but financials were a drag, with a 1.74% return. The big four banks were all dragged down to some extent by the Federal Budget, as changes to capital gains tax and negative gearing were expected to hit residential property lending. The best performers were consumer discretionary up 18.02%, with Wesfarmers up over 20%. Information technology was up 17.40%, listed property 13.55%, and industrials 9.05%. As expected, the big falls were seen in energy, down -16.72%, while the other strugglers were utilities down -6.08% and health care down -6.61%. Finally, the ASX Small Ordinaries index was up 3.32% for Q2, but still down -7.91% year-to-date.